Wow...what a week! Students started back to school this past Monday, and it has been a whirlwind of excitement and new beginnings.
Before the students returned to school, the SMS faculty participated in a Data Carousel in the library in order to view and understand the ACT Aspire and STAR data from the 2014-2015 academic school year. This is an important process which can encourage academic growth during the 2015 school year.
Before the students returned to school, the SMS faculty participated in a Data Carousel in the library in order to view and understand the ACT Aspire and STAR data from the 2014-2015 academic school year. This is an important process which can encourage academic growth during the 2015 school year.
Steps for Data Carousel:
1. Our teachers created 6 groups of 5.
2. Each group was assigned to a certain chart.
3. When the bell rang, the teachers were to view the charts silently within their groups for 3 minutes. While silently viewing the charts, the teachers were to jot down any notice statements, questions, patterns, and/or comments on their personal graphic organizers.
4. When the second bell rang, the teachers were then able to collaboratively talk for 2 minutes about any discoveries that were made. As a group, they were responsible for adding one artifact (post-it note with comment) to the chart.
5. The third bell indicated it was time for the groups to switch to the next chart and repeat the process again. This occurs until every group has been able to view and comment on all 6 charts.
Here is a list of all 6 charts that were created for this exercise:
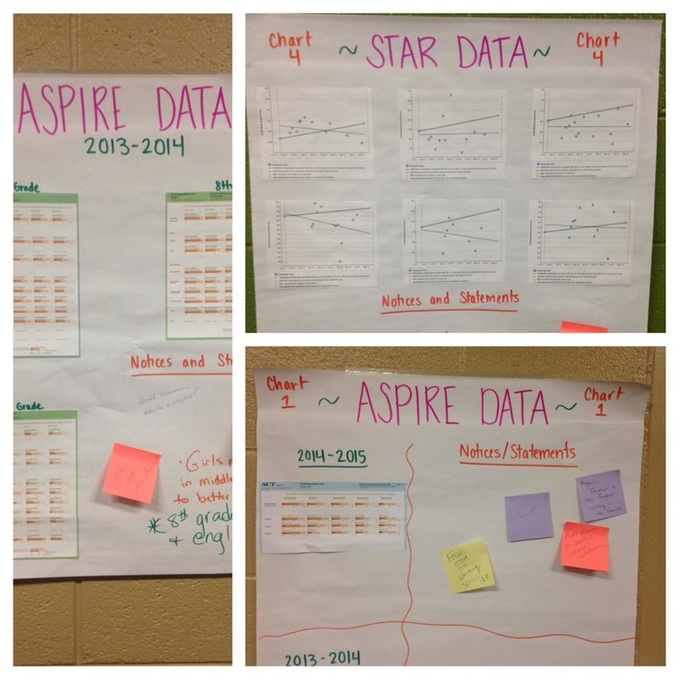
Chart 1: 2013-2014 AND 2014-2015 Aspire Data broken down by grade and subject (these graphs can be located by each school using this website: actaspire.org and using your admin's unique login). Be sure to leave an area for teachers to write notices or comments on the charts.
Chart 2: 2013-2014 Aspire Data broken down by race, gender, and free/reduced lunch qualification.
Chart 3: 2014-2015 Aspire Data broken down by race, gender, and free/reduced lunch qualification. (teachers were able to find patterns and contrasts between charts 2 and 3 that were profound and eye-opening)
Chart 4: STAR reports randomly selected from 6 students who were receiving Tier II Instruction (they were referred to Tier II by the PST *Pupil Support Team OR Problem-Solving Team*). The trend line was declining on the graph, while the distance from the goal line was increasing.
Chart 5: STAR reports selected from 6 students that depicted students receiving Tier II Instruction (declining trend line) with a red "change" line, and the right side of the graph depicted the same students transitioning to Tier III instruction (ascending trend line, which revealed academic growth).
Chart 6: STAR reports selected from 6 students that depicted the students leaving Tier III instruction and going into Tier II instruction (declining trend line, again).
Through this process of viewing the data, teachers were able to fully understand the importance of Tier II and Tier III instruction. The charts revealed the effect that Tier III instruction had on a student's STAR trend line and academic progress.
**The wonderful and amazing Yoey Epp had prepared the charts this summer before she accepted a position at Endeavor**
**The wonderful and amazing Yoey Epp had prepared the charts this summer before she accepted a position at Endeavor**
 RSS Feed
